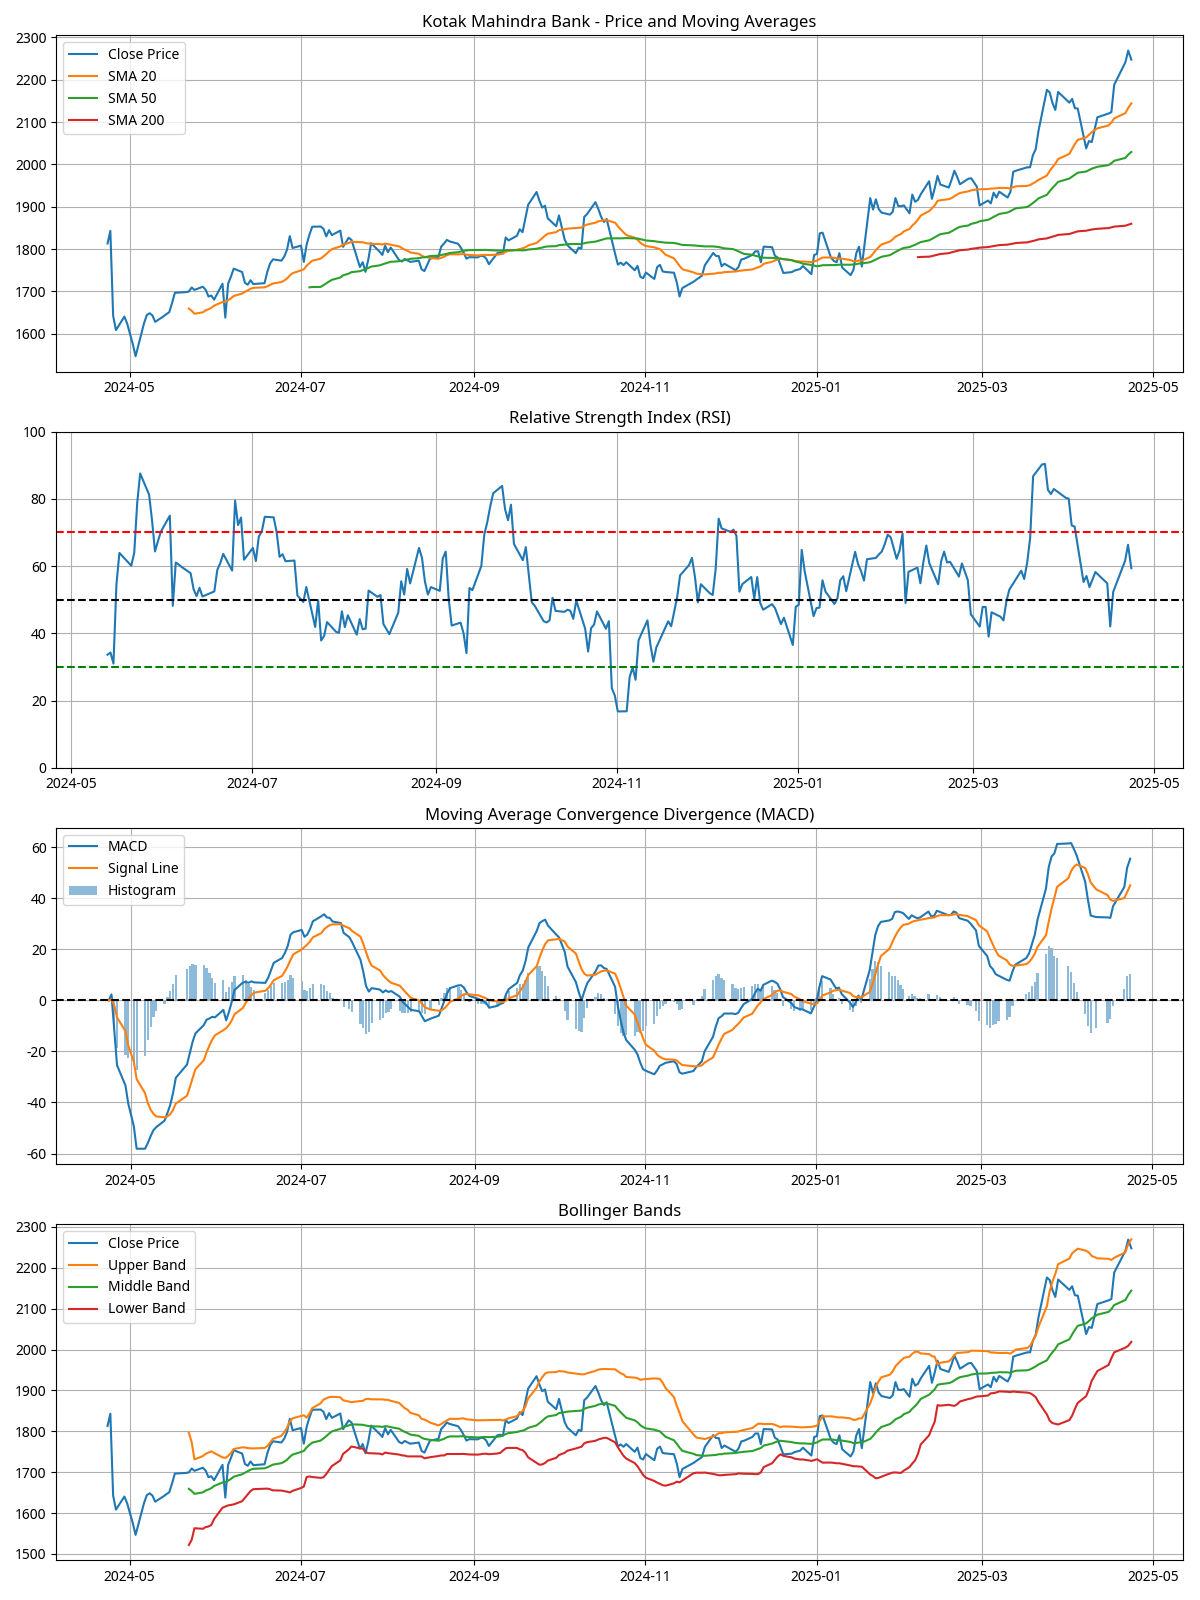
Price Trend Analysis
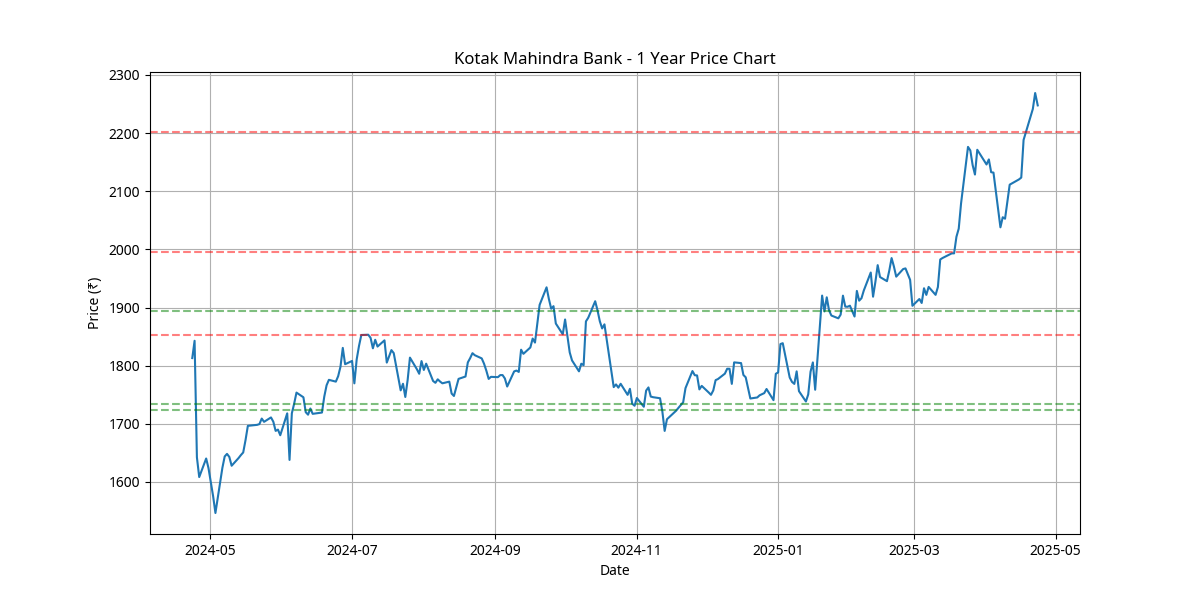
1 Year Price Chart
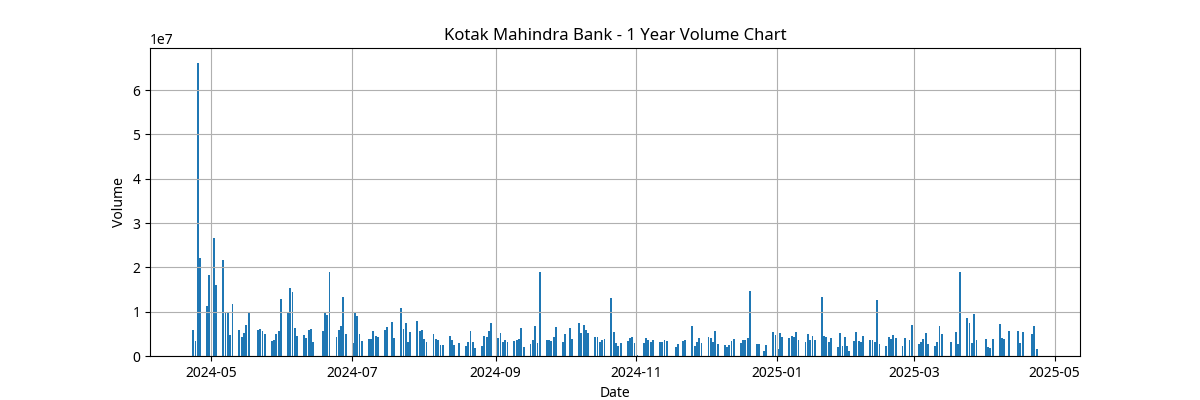
Volume Chart
Support & Resistance Levels
Key Support Levels:
- ₹1,893.90 (identified on February 28, 2025)
- ₹1,723.75 (identified on January 13, 2025)
- ₹1,733.35 (identified on December 20, 2024)
Key Resistance Levels:
- ₹2,202.50 (identified on March 25, 2025) - Recently broken, now potential support
- ₹2,301.90 (recent high, potential near-term resistance)
- ₹2,350.00 (psychological level, potential future resistance)
Chart Patterns
Double Top Pattern (October 2024):
A double top pattern was identified around October 21, 2024, at price level ₹1,915.35. This bearish reversal pattern did materialize into a correction.
Double Bottom Pattern (January 2025):
A double bottom pattern was identified around January 20, 2025, at price level ₹1,729.60. This bullish reversal pattern successfully predicted the current uptrend, with the stock gaining approximately 30% since the pattern formation.